ThCharts图表
吴少文 2022/4/22 vue
# ThCharts图表
封装ECharts一个基于 JavaScript 的开源可视化图表库
- 使用时可在标签上配置ref,通过 $refs.chart 获取图表的实例进行扩展使用
# 依赖说明
使用时完全遵循ECharts 5.3.2 (opens new window)手册使用
# 效果预览
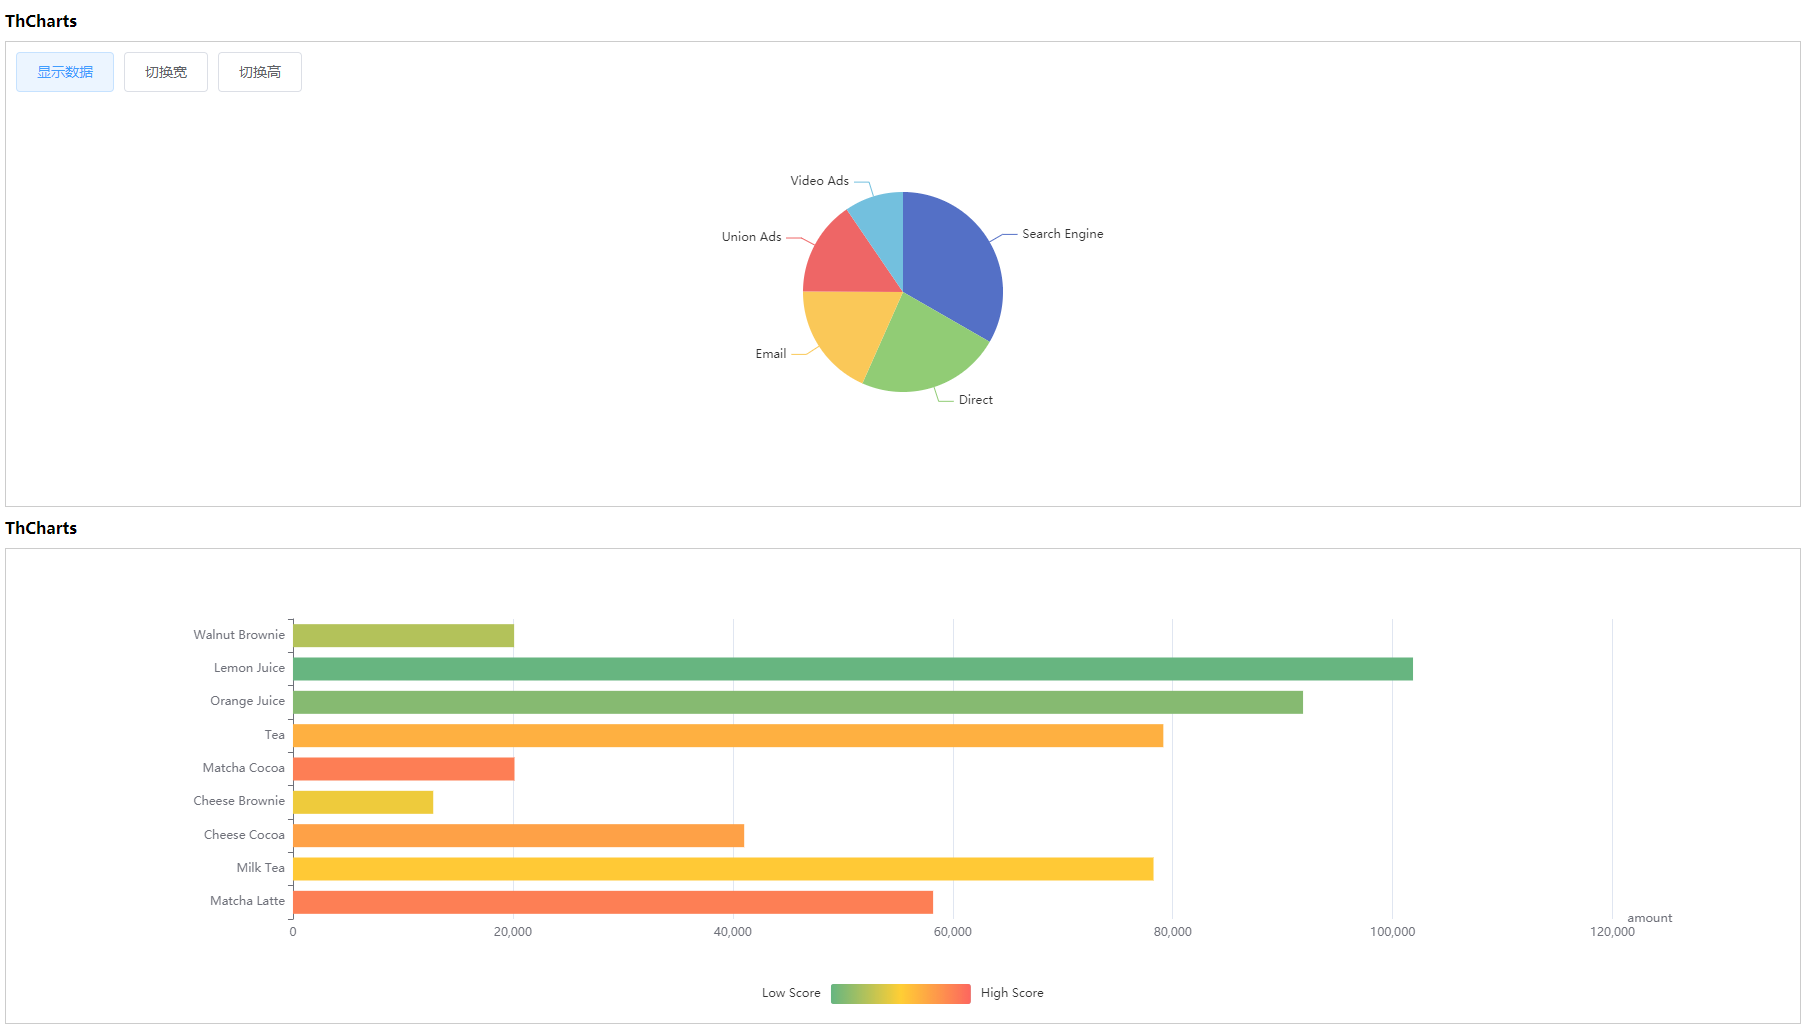
# 基本使用
<template>
  <div>
    <div>
      <el-button @click="switchBtn">显示数据</el-button>
      <el-button @click="switchWidthBtn">切换宽</el-button>
      <el-button @click="switchHeightBtn">切换高</el-button>
    </div>
    <th-charts :option="option" :height="height" :width="width" />

    <th-charts ref="refCharts2" :option="option2" />
  </div>
</template>

<script>
export default {
  data () {
    return {
      randomNumber: true,
      height: '400px',
      width: '100%',
      option: {},
      option2: {
        dataset: {
          source: [
            ['score', 'amount', 'product'],
            [89.3, 58212, 'Matcha Latte'],
            [57.1, 78254, 'Milk Tea'],
            [74.4, 41032, 'Cheese Cocoa'],
            [50.1, 12755, 'Cheese Brownie'],
            [89.7, 20145, 'Matcha Cocoa'],
            [68.1, 79146, 'Tea'],
            [19.6, 91852, 'Orange Juice'],
            [10.6, 101852, 'Lemon Juice'],
            [32.7, 20112, 'Walnut Brownie']
          ]
        },
        grid: { containLabel: true },
        xAxis: { name: 'amount' },
        yAxis: { type: 'category' },
        visualMap: {
          orient: 'horizontal',
          left: 'center',
          min: 10,
          max: 100,
          text: ['High Score', 'Low Score'],
          // Map the score column to color
          dimension: 0,
          inRange: {
            color: ['#65B581', '#FFCE34', '#FD665F']
          }
        },
        series: [
          {
            type: 'bar',
            encode: {
              // Map the "amount" column to X axis.
              x: 'amount',
              // Map the "product" column to Y axis
              y: 'product'
            }
          }
        ]
      }
    }
  },
  methods: {
    switchHeightBtn () {
      this.height = Math.random() * 300 + 200 + 'px'
    },
    switchWidthBtn () {
      this.width = Math.random() * 400 + 200 + 'px'
    },
    switchBtn() {
      this.randomNumber = !this.randomNumber
      if (this.randomNumber) {
        this.option = {
          xAxis: {
            show: true,
            data: ['衬衫', '羊毛衫', '雪纺衫', '裤子', '高跟鞋', '袜子']
          },
          yAxis: {
            show: true
          },
          series: [
            {
              name: '销量',
              type: 'bar',
              data: [5, 20, 36, 10, 10, 20]
            }
          ]
        }
      } else {
        this.option = {
          xAxis: {
            show: false
          },
          yAxis: {
            show: false
          },
          series: [
            {
              type: 'pie',
              radius: '50%',
              data: [
                { value: 1048, name: 'Search Engine' },
                { value: 735, name: 'Direct' },
                { value: 580, name: 'Email' },
                { value: 484, name: 'Union Ads' },
                { value: 300, name: 'Video Ads' }
              ]
            }
          ]
        }
      }
    }
  }
}
</script>
# Attributes
| 参数 | 说明 | 类型 | 是否必填 | 默认值 |
|---|---|---|---|---|
| option | 选项 | object | 是 | -- |
| width | 图表宽度 | string | 否 | 100% |
| height | 输入框尺寸 | string | 否 | 450px |